
Guide to Back-of-the-Envelope Calculations for Global Health and Wellbeing
By Peter Hickman
Editor’s note: This article was published under our former name, Open Philanthropy.
Open Philanthropy program staff often create back-of-the-envelope calculations (BOTECs) as they decide whether to make a grant. This is especially common for areas in our Global Health and Wellbeing (GHW) portfolio.
We introduced BOTECs in a recent post: they are rough quantitative models for estimating the social return on investment (SROI) of potential grants. Program staff use them to compare a grant’s expected benefits to its costs. (We don’t rely on BOTECs alone to make grant decisions; we also consider hard-to-model factors such as a grantee’s leadership and track record.)
The previous post focused on sharing examples of BOTECs. This post explains our process for drafting them and the framework underlying that process. We’re also sharing a lightly edited version of our full guide to creating BOTECs. We hope the post sheds light on our process and helps other funders with theirs.
(If you are a funder and want to set up your own BOTECs, feel free to get in touch — we’d be happy to answer questions!)
Simplified BOTEC structure
The structure of a BOTEC usually includes:
- Benefits per year: How much benefit the grant delivers each year, assuming it succeeds.
- Years of benefits: How many years of benefits it delivers.
- Chance of success: The probability that it successfully delivers a given benefit.
- Cost: How much it costs to fund the grant.
The bottom line of a BOTEC is the social return on investment (SROI). It’s similar to financial return on investment — but rather than considering the financial benefits to the investor, SROI adds up all the benefits to society.
The simplified BOTEC structure is SROI = [Benefits Per Year] x [Years of Benefits] x [Chance of Success] / Cost. (More details in the full guide.)
Benefits per year
Much of our work is focused on improving human health and wellbeing — either by preventing illness and premature death, or by boosting incomes.[1]We’ve also modeled other kinds of benefits to individuals — like getting a trial sooner after being accused of a crime. In those cases, we plug in an estimated health or income benefit that we think is roughly as valuable to the beneficiaries as the actual benefit. We don’t have a systematic … Continue reading
To compare the benefits of health and income, we created a common unit: “Open Phil dollars” ($OP). We define an OP dollar as equivalent to the benefit of giving $1 to someone earning $50,000 a year; we chose $50,000 as a reference point because it’s roughly the average income in high-income countries.
To calculate yearly benefits, we think about how many beneficiaries a grant has, and the grant’s average yearly value (in $OP) to each beneficiary.[2]In some cases, there is no obvious beneficiary population. For example, some grants within our Effective Giving and Careers program help people find careers with high social impact; this directly benefits them, but what we really care about is how their work will benefit others. In these cases, the … Continue reading
Valuing income benefits
We value income differently depending on the beneficiary’s initial income. This makes intuitive sense: someone earning $50,000/year will benefit very little from an extra dollar, but that same dollar would be worth much more to someone earning $500/year.
To capture this intuition in our calculations, we translate income benefits into OP$ using a logarithmic utility function. To someone at a particular income level (BaseIncome), additional income (IncomeGain) has the value:
\( \text{OP}\$ = \$50,000 \ln\left(\frac{\text{IncomeGain} + \text{BaseIncome}}{\text{BaseIncome}}\right) \)
Here, ln is the natural logarithm.[3]We use $50,000 as a scaling factor so that a single “OP dollar” represents the utility from gaining $1 at an income level of $50,000 (BaseIncome=$50,000 and IncomeGain=$1). The logarithmic function has the practical upside of implying that all percentage changes in income are valued equally — a 1% income increase, for example, has a consistent value regardless of the individual’s baseline income. This is useful for BOTECs because it means we need only estimate the percentage gain in income from a grant, rather than the beneficiaries’ base income level. There’s also real-world evidence that people value income changes roughly as log utility would suggest.[4]E.g. Kahneman & Deaton find that a measure of self-reported well-being increases roughly linearly with ln(income). Chetty (2006) examines data on how workers respond to wage changes and finds the data are best explained by utility with a coefficient of relative risk aversion near 1, … Continue reading (More in Guide.)
Valuing health benefits
Like many experts and institutions in global health, we use “disability-adjusted life years” (DALYs) as a way to measure the burden of a health condition. An intervention that improves health will thereby reduce DALYs.
The DALY total for a condition adds up lost years of life (through premature death) and lost years of healthy life (through harms which disrupt life without causing death). The latter is measured using a “disability weight” based on severity; to calculate it, multiply the disability weight of a condition by how long it lasts.[5]The disability weight aims to capture the intensity of the suffering or limitations caused by the illness. For example, mild colds have a weight of 0.6%, while late-stage cancers have weights around 50%.
To compare health and income benefits, we estimate how much people value longer, healthier lives.[6]While it may seem callous to put a “value” on life, it’s a necessary condition of making difficult trade-offs about how to allocate finite resources between interventions that improve health and income. Most studies find that people are willing to pay between 6 months and 10 years of income for another year of life.[7]For a readable discussion of this literature, see this blog post from Open Phil’s Deena Mousa. We use a figure between those extremes, valuing a year of life as highly as doubling someone’s income for three years. This is worth roughly $OP 100,000.[8]A single year of doubled income for one person = $50,000 * 1 * ln (1 + 100%) * 1 = $50,000 * ln (2) = ~$35,000. So three years of doubled income is worth ~$100,000 OP.
Figure 1: Estimates of the Value of a Year of Life
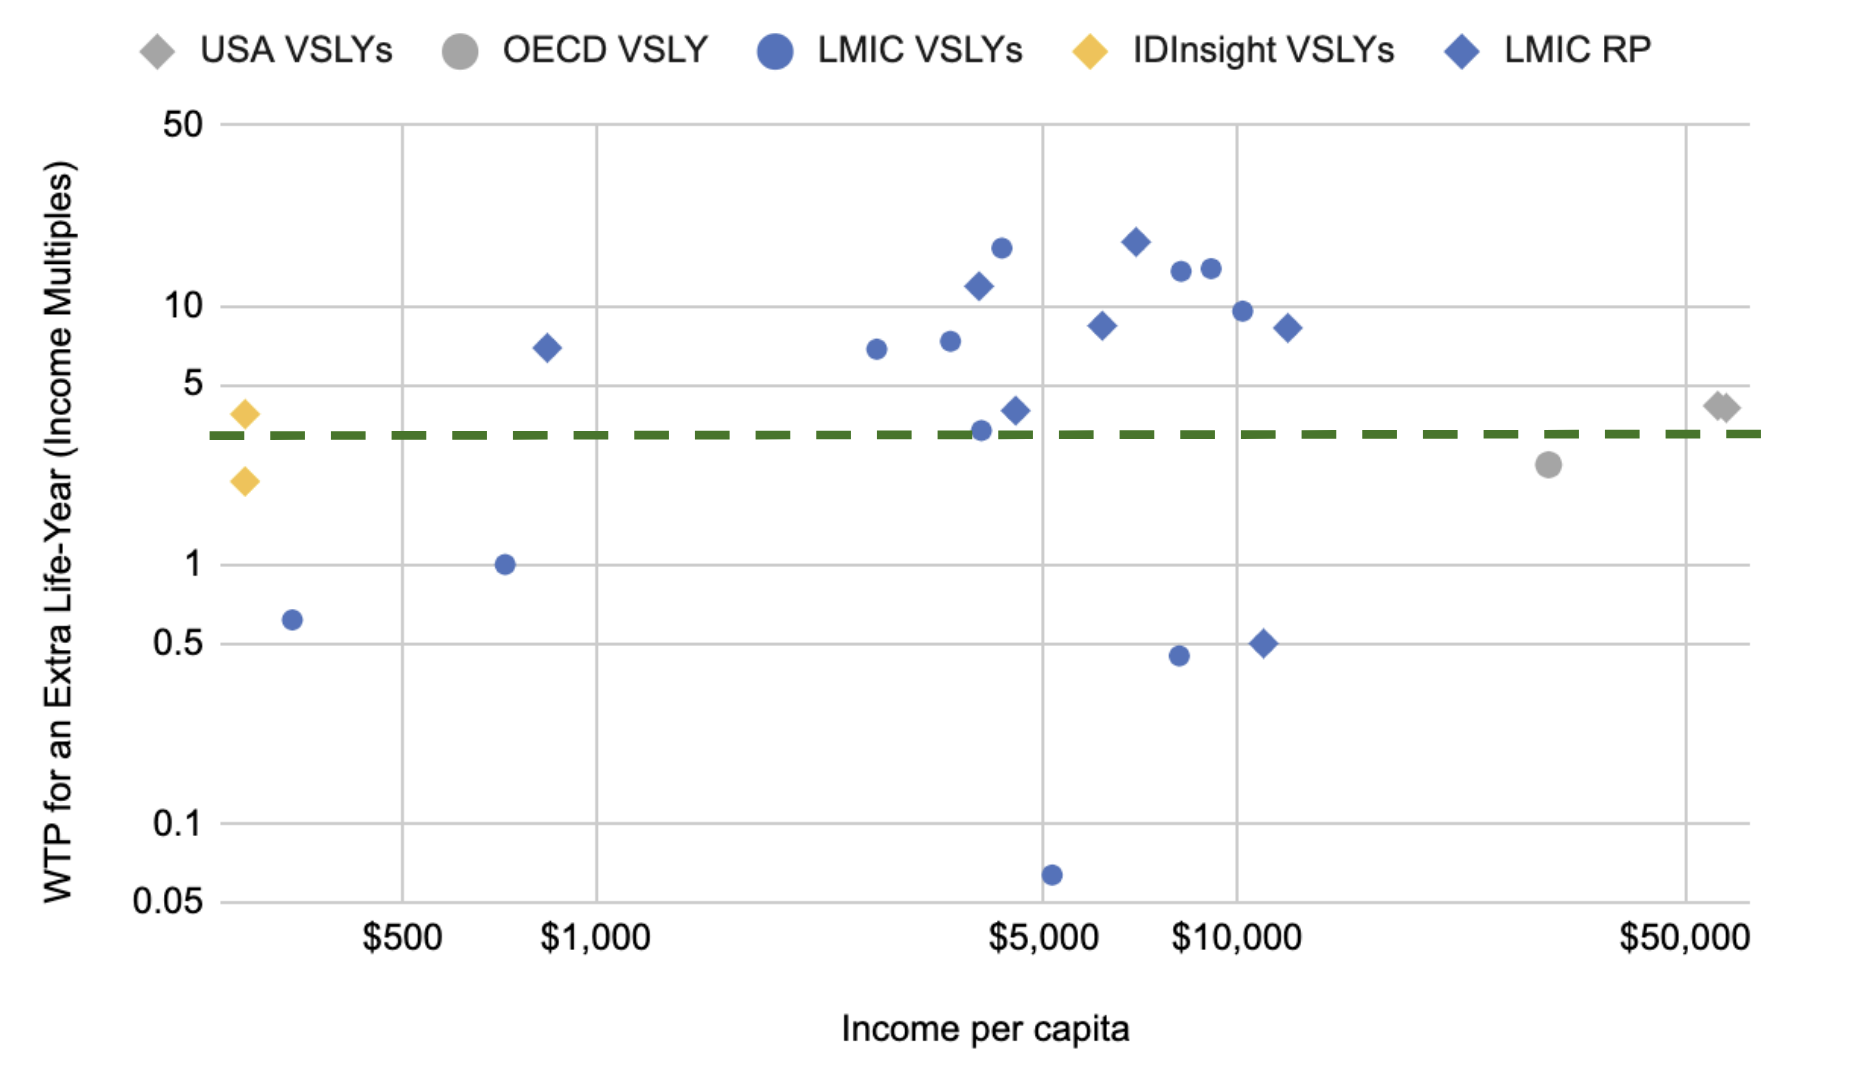
This chart (source) plots results from several studies on how much people at different levels of income value an extra year of life (“value of a statistical life-year,” or VSLY). The results vary widely; we use a middling figure (3x income), represented by the green line.
In cases where DALYs primarily come from premature death (rather than disability), we calculate them as follows:
- Take the DALY estimates from an external source.[9]Usually the Global Burden of Disease study; we also sometimes use the WHO or other studies.
- Multiply them by age-specific weights. For example, we weigh each DALY lost from a 10-year-old’s death more heavily than each DALY lost from a 70-year-old’s.
- The weights we use are based on those of our long-time partner GiveWell, which chose its weights in part based on a survey by IDinsight of people in Ghana and Kenya living in poverty. The respondents indicated that they valued the lives of children much more highly than the lives of adults, and this same pattern showed up when GiveWell surveyed some of its donors. (See here for the range of values and an explanation of how GiveWell came up with them.)
Years of benefits
We believe that our grants have a bounded total impact (not infinite). The bounding can come from many places, but one of the most important is the amount of time that a benefit exists because of us. We generally model this in one of two ways. (More in Guide.)
Persistence
When we expect a benefit to be temporary, we use persistence to think about how long it will last. For example, a new policy might be changed after a country’s next election, or as part of its next budget cycle. Outside of policy, we might use persistence to look at areas like:
- Migration (how long someone stays in a new country).
- Career choice (how long someone works at a new job).
- Economic growth (how long it takes before GDP converges to its prior trajectory).
Speed-ups
Even if a benefit has no natural endpoint, we assume that it eventually would have happened even without our support. We use speed-ups to think about how much longer it would take for something to happen without a particular grant.
This often comes up with grants for scientific research or technological development (including drug development), since new discoveries tend to persist indefinitely. For example, if we support a researcher to create a new vaccine, we’d want to estimate:
- How long we think it will take to develop and deploy the vaccine, given our funding.
- How long we think it would take for this to happen otherwise.
Our default assumption is that a grant speeds up a given benefit by five years. We use shorter speed-ups for more active areas where it seems more likely that someone else would address the issue, and longer speed-ups if the area is more neglected. (More in Guide.)
Chance of success
Many grants fund projects that have a high chance of failing and delivering no value: a vaccine trial could show no benefits, a housing reform policy could fail to pass, or technical assistance could fail to get buy-in from policy leaders. Our philosophy of hits-based giving means we’re comfortable with these sorts of grants.
Our BOTECs thus include a parameter for the chance of success. Some of our program areas have standard “base rates” for success that help to ground estimates, e.g. a 50% chance that a Phase 1 trial advances to Phase 2.[10]These base rates are often based on historical data about similar situations (e.g. what fraction of all Phase 1 trials have advanced). Staff will then adjust these rates based on how a specific grant compares to the average (some are more promising, some less).
We also log predictions about particular outcomes for grants we make, and internally track them to see how well we are doing, consistent with our operating value of calibration. A recent internal review of ~1,000 predictions found that staff were fairly well-calibrated, though slightly optimistic.[11]For example, things predicted to happen ~40% of the time actually happened ~35% of the time.
Cost
The cost side is often straightforward; if Open Phil pays a grantee $1 million, then the cost is $1 million. In some cases, (e.g. testing statins to treat tuberculosis), Open Phil is one of multiple funders behind a project. In those cases, we don’t take full credit for all the benefits of the project; we use one of two approaches.
The first approach is to give ourselves a fraction of the credit equal to the fraction of the cost we covered. If we funded 50% of a grant that turned out to be worth $OP 10 million, our credit would be $OP 5 million. However, when it’s hard to tell what fraction we covered (e.g. we fund one of several charities advocating for a given policy, and we don’t know how much the others raised), we’ll use the second approach — making a subjective estimate based on details of the specific situation. (More in Guide.)
Comparison to the bar
Dividing benefits by costs gives the SROI, which we then compare to our “bar” for impact (currently slightly over 2,000x). We generally try to ensure all of our grants are above the bar.
We also pay attention to qualitative factors that are hard to model, such as the grantee’s track record and what we’ll learn from making the grant.
We sometimes make multiple SROI estimates, starting with different assumptions, to determine how confident we are that a grant is above the bar. This can help us find key parameters to research more deeply (e.g. because even small differences have a major impact on SROI, or because different assumptions lead to very different estimates). Nonetheless, we eventually choose a single best-guess SROI for every large grant, because this helps us track our impact and compare SROIs between program areas.
Additional considerations
Our BOTEC guide goes into detail on how Open Phil handles discounting the future and diminishing marginal returns in our BOTECs. It also provides recommendations for how to calculate “best-guess” SROIs, how to make well-calibrated predictions, how to allocate credit between funders and actors, and how to format spreadsheets for ease of use.
Footnotes