Skip to Content

Cost-Effectiveness

We aim to direct our funding where it can have the greatest expected impact.

We start by identifying the broad causes that seem most promising, and recommending how to allocate funding across those causes based on potential impact. Within each cause, we compare grant opportunities to find the ones with the highest expected impact per dollar.

We fund many kinds of work — from global health programs with measurable outcomes to research and advocacy where results are harder to quantify. We use different methods to estimate cost-effectiveness depending on the nature of the work, but all are designed to help us compare opportunities and decide where our funding can do the most good.

These estimates are never exact; the data we use are imperfect, and many important factors can’t be easily measured. But quantifying expected impact, even roughly, helps us understand trade-offs, refine our approach, and learn from the results of our grants.

This page focuses mostly on our grantmaking for global health and wellbeing, where our methods to evaluate cost-effectiveness are most developed, but similar principles guide our approach across all our work.

How we measure impact

Much of our work aims to improve human health and wellbeing — typically either by preventing illness and premature death or by boosting incomes and economic growth.

However, health and economic benefits aren’t directly comparable: Is it better to raise the incomes of 100,000 people by 10% for a year, or prevent 1,000 cases of tuberculosis? To weigh these trade-offs, we study the economic literature to understand how people value health and economic improvements, and use that information to define a common unit of impact: “Coefficient Giving dollars” ($CG).

Economic benefits

To measure economic benefits, we use a logarithmic model of the utility of income — meaning that a 1% increase in income is equally valuable, regardless of someone’s starting income level, and a dollar of income is worth 100x more to someone who has 100x less. This approach fits the economic literature on wellbeing and keeps our estimates consistent and relatively simple.

We define one $CG as equivalent to the benefit of giving $1 to someone earning $50,000 a year — roughly the U.S. GDP per capita when we adopted this framework. Under our model, giving $1 to someone earning $500 a year would be worth about $CG 100 — because it represents a welfare gain 100 times larger.

That result makes intuitive sense: a dollar means far more to someone living on $500 a year than to someone living on $50,000. This is one of the main reasons we focus much of our economic grantmaking on low- and middle-income countries, where the same amount of funding can create much larger welfare gains.

That said, we sometimes work in higher-income countries if we find exceptional opportunities to provide economic benefits. For example, better housing policy in major U.S. cities could help millions of people find higher-paying jobs.

Health benefits

Like many experts and institutions in global health, we use “disability-adjusted life years” (DALYs) to measure the burden of health conditions.

DALYs capture both years of life lost to premature death and years of healthy life lost to illness or disability. While they are an imperfect measure, they provide useful information beyond simply tracking mortality or morbidity, and they remain the most widely used way to compare health conditions across populations. Estimating the value of a year of healthy life can feel uncomfortable, but it’s necessary for making consistent trade-offs between health and income interventions.

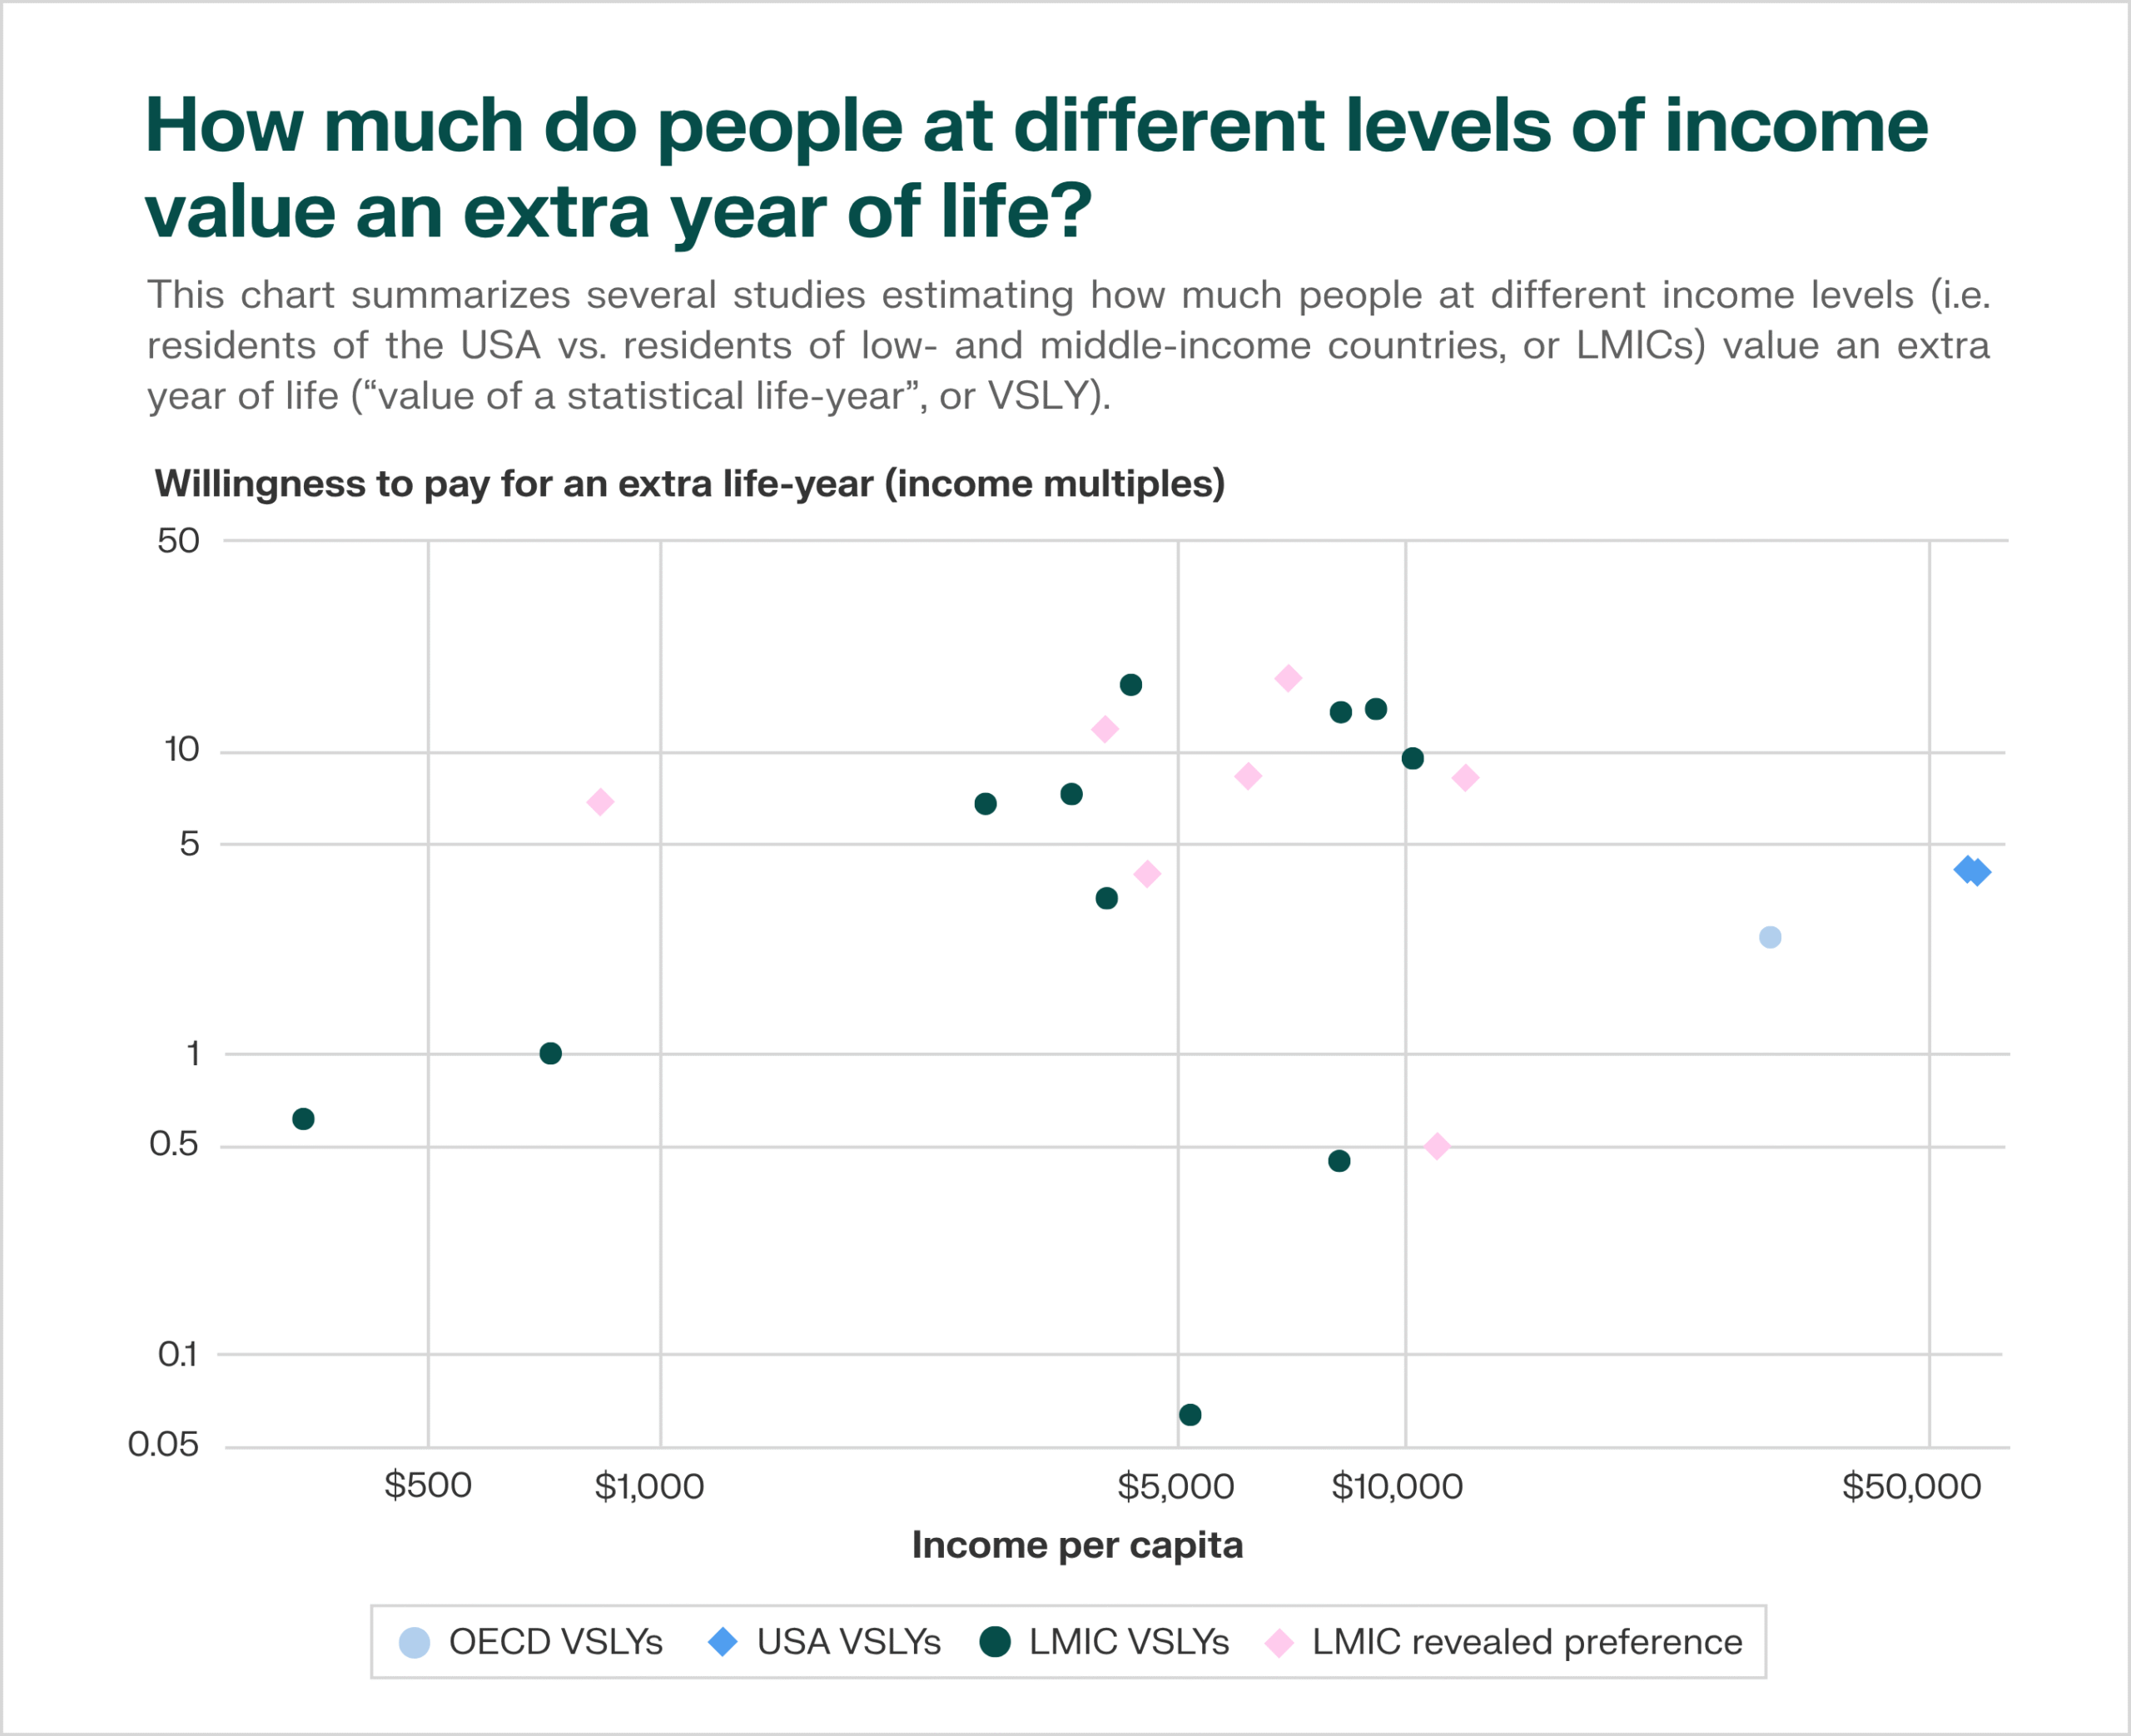
To compare health and income benefits, we estimate how much people value longer, healthier lives. Most studies find that people are willing to give up 6 months to 10 years of income for one additional healthy year of life — which, using our $50,000 reference income, corresponds to between $25,000 and $500,000. We use a figure in the middle of this range: our models value a healthy year of life at around $CG 100,000 — roughly the same as increasing 200 people’s incomes by 1%.

This conversion allows us to compare health and economic impacts on a common scale — for instance, evaluating the benefits of reducing malaria, improving air quality, or helping people find higher-paying jobs using the same basic units.

This chart summarizes several studies estimating how much people at different income levels value an extra year of life (“value of a statistical life-year”, or VSLY).
Source: Coefficient Giving (2021)

Other benefits

Some grants have more indirect impacts on health or income. For example, efforts to increase housing supply or accelerate scientific progress can yield large downstream benefits.

When we fund such work, we estimate how the resulting changes — more housing, faster innovation — translate into health or income gains, so we can compare them with more direct interventions.

Our “bar” for grantmaking

We calculate the social return on investment (SROI) for each grant by dividing its philanthropic value in $CG by its cost in USD. Our current minimum “bar” for SROI is around 2,100x — meaning that for every dollar we spend, we aim to generate at least $CG 2,100 in value. Roughly speaking, that’s equivalent to giving someone at least a year of healthy life for every $50 we spend.

We usually won’t fund an opportunity unless the expected impact meets or exceeds that bar. That could mean a near-certain 3,000x opportunity, or a 10% chance of a 30,000x return. The latter is an example of our “hits-based giving” approach, where a few major successes can provide a large share of our total impact.

We periodically revisit our bar. It may rise as we find additional highly cost-effective opportunities, or fall if we have more funding to allocate. That’s because we prioritize funding the strongest opportunities first. New opportunities “crowd out” opportunities just above the old bar, while new funding lets us support opportunities just below it. (These “below the bar” opportunities would still be much more cost-effective than most we’ve evaluated — they might provide a year of healthy life for $55 or $60 instead of $50.)

Using a single bar helps us better advise donors on how to distribute money across our funds: if one area is struggling to find above-the-bar grants, while another has too many strong opportunities to fund them all, we can shift resources until the expected “last dollar” impact is roughly equal across causes. Once we’re at a point where we can’t increase our expected impact by moving a dollar between causes, we’ve optimized our “portfolio” — every dollar is doing as much good, in expectation, as it can. Because the world changes and our estimates are uncertain, we treat optimization as an ongoing process, rather than an endpoint.

How this works in practice

For very small or hard-to-model grants, we may skip a full cost-effectiveness analysis and focus on other factors instead. But whenever possible, we test each opportunity against our bar. Here’s a simplified example of how that works:

  1. We learn about a team developing a cheap, portable scanner to detect lead in paint.
  2. To make a sizable impact, the scanner must:
    1. Have its accuracy validated by regulatory bodies.
    2. Be used by national regulators to detect lead, in countries where lead paint represents a serious health risk.
    3. Enable regulators to reduce lead content in the paint market.
  3. We estimate the probability of each step under several scenarios — including a “best guess” — and use the estimates to calculate a range of plausible outcomes. By multiplying our best-guess estimates, we find that we’d expect the project to reduce the total global lead burden by 0.16%.
  4. That implies an expected value of roughly $CG 2.3 billion, or about 23,000 years of healthy life saved, for a cost of $350,000. The SROI would be around 6,500x, well above our bar.
  5. While this estimate is uncertain, it’s strong enough for us to make the grant.

For more details on this analysis, see this section of a blog post where we shared sample cost-effectiveness estimates (also known as “back-of-the-envelope calculations”, or BOTECS). In another post, we go into more detail on our process for creating BOTECs.

Limitations and uncertainties

Even with these frameworks, it can be very difficult to compare grant opportunities. Our approach has several limitations:

  • Incomplete data: We often have to rely on studies with small sample sizes or uncertain assumptions about how problems will evolve over time. This makes for imprecise estimates of a problem’s current or future importance, especially for neglected areas with little existing data.
  • Blind spots: Even with good data, it’s easy to miss important harms or benefits, or to overlook factors that seem obvious in hindsight. These gaps reflect both the gaps in available evidence and the limits of our own perspective.
  • Philosophical challenges: Measuring our impact involves economic and philosophical questions, like how to weigh future benefits versus present-day benefits, that have no one “correct” answer.
  • Risk of overreliance on quantification: Models can overvalue what’s easily measurable and undervalue harder-to-quantify benefits like basic research or policy change. We try to address this by weighing qualitative factors — such as grantee leadership or advice from experts in the field — alongside numbers. Our quantitative frameworks are only tools to aid in decision-making, not the full basis for making any particular grant.

Despite these challenges, we believe that setting clear goals and defining acceptable tradeoffs forces us to confront these questions head-on and makes our reasoning clearer and more consistent. It helps us learn from our results and continuously improve our ability to direct resources to where they can have the most impact.
More in Research & News

Strategic Cause Selection

Philanthropists tend to choose causes based on personal experience, geographic proximity, or emotional appeal. This approach is understandable — personal connection is what motivates many people to give in the first place. But some causes offer far greater opportunities for impact than others: the same donation might save ten lives in one place but a thousand in another.

Worldview Diversification

When choosing which causes to support, we face difficult moral and empirical questions without clear "right" answers. To address this uncertainty, we divide resources across several broad approaches to doing good, each grounded in a different worldview.

Hits-Based Giving

One of our core values is our tolerance for philanthropic risk. We’ve seen that the biggest philanthropic wins often come from ideas that seem unlikely to succeed, so we’re open to funding a lot of work that could fail in order to find a few transformative successes.